Unlock Advanced Data Visualisation Features - Sign Up for Free
Level up your data presentation game by signing up for our free services. Start saving charts, benefiting from AI generated insights, selecting custom hex colours, and more. Our platform guarantees slick, interactive and easily embeddable visualisations into Notion or wherever you prefer.
Features
- Chart Saving: Preserve your vital data visualisations with our saving option, ensuring your charts are easily accessible for future use.
- AI Generated Charts and Insights: Let our AI technology assist you by creating insightful charts and deriving valuable insights from your data.
- Custom Hex Colours: Tailor your visualisations with our custom hex colour feature, adding a personalised touch to your data presentations.
Use Cases:
- Effective Data Presentation: Deliver compelling presentations by integrating our stylish and interactive charts into your slides or reports.
- Data Analysis: Utilize AI generated charts and insights for thorough data analysis, aiding decision-making processes.
- Content Creation: Enhance your blogs, articles, or social media content by embedding our dynamic and customisable visualisations.
Harness the power of advanced data visualisation by signing up for our free services. Customize and share your charts effortlessly, while benefiting from our AI-enabled insights.


Graphy.app Alternatives:
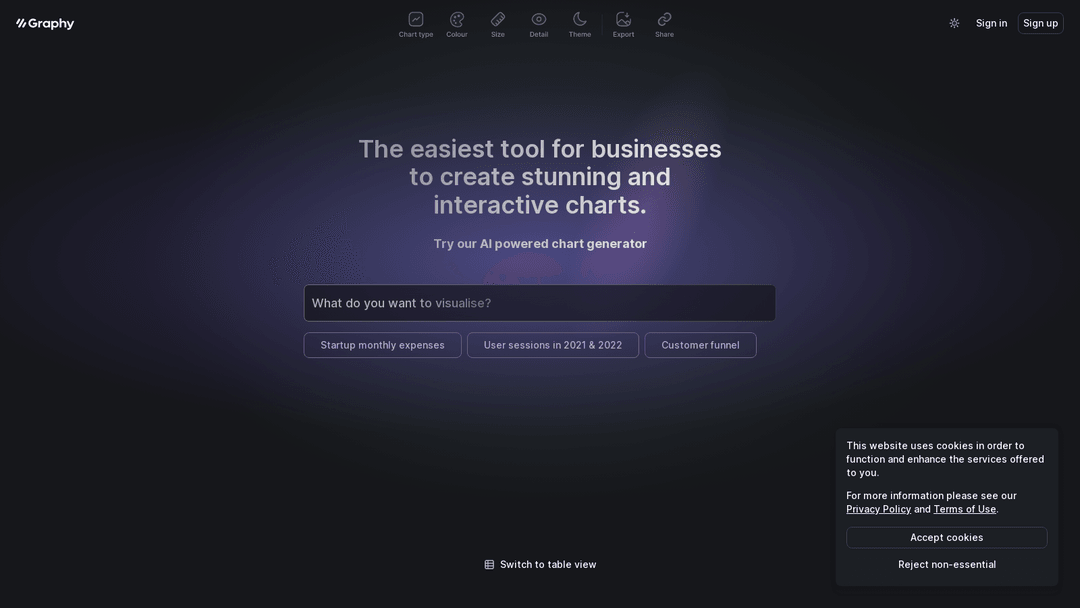
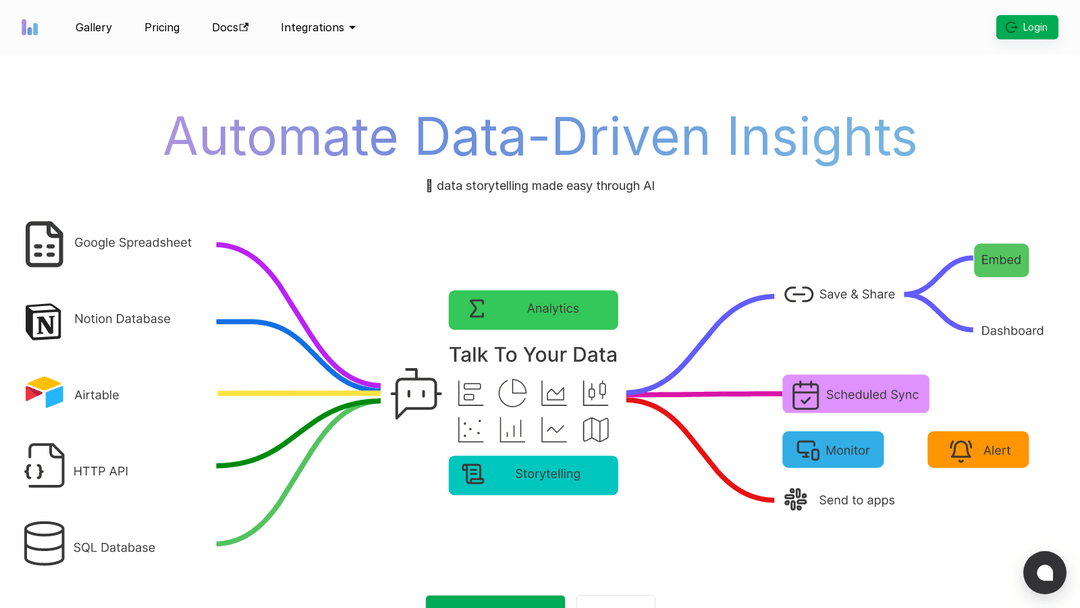
1. Graphy app
Graphy is an AI-powered tool for businesses to create and share interactive charts.
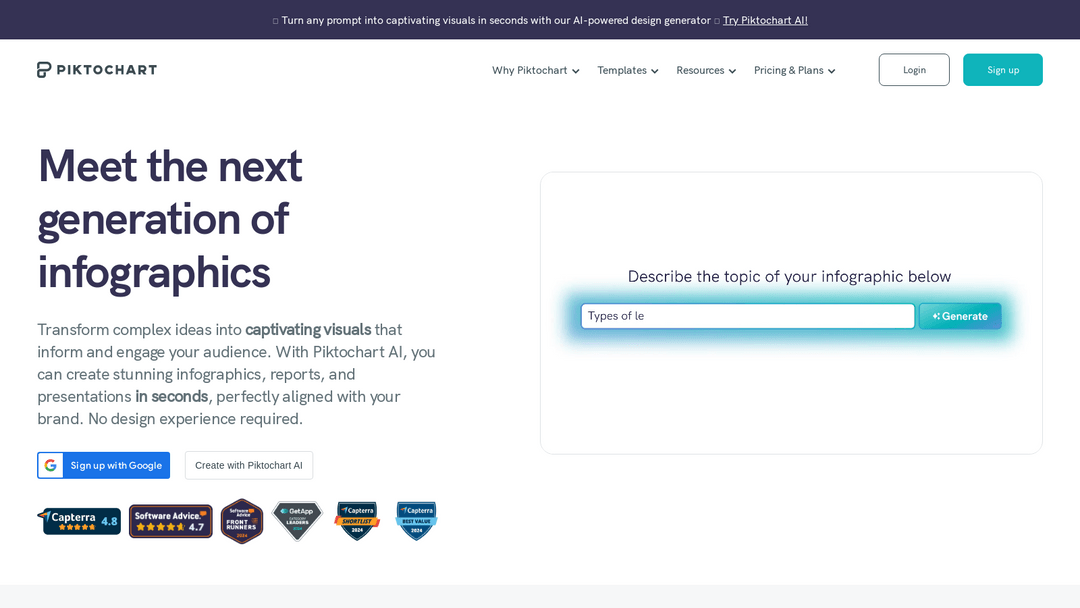
2. Piktochart
Transforms prompts into professional visuals for infographics and presentations. No experience needed.
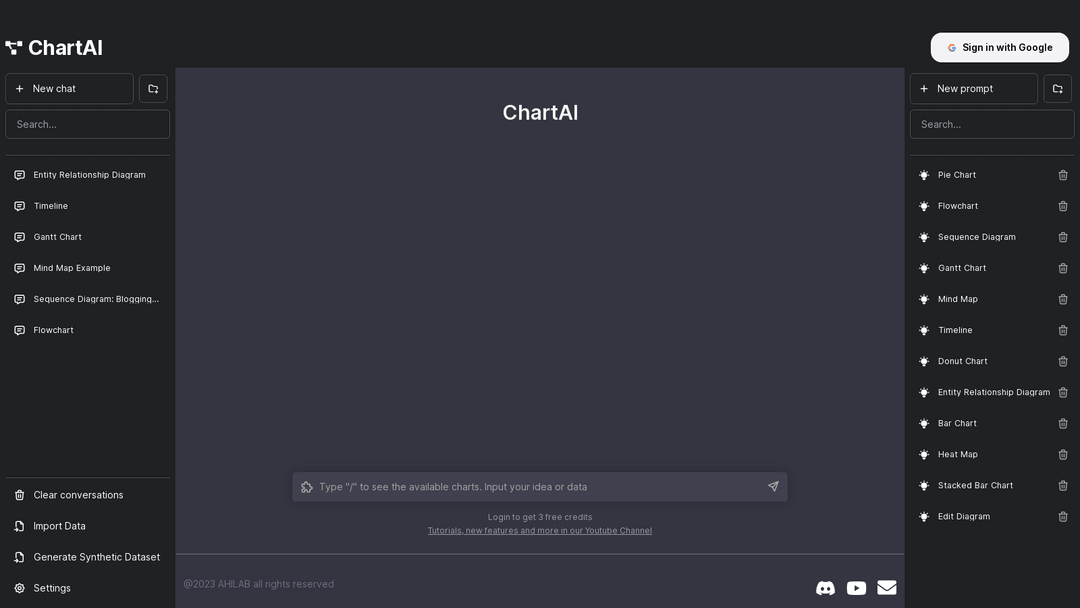
3. Chartai
Streamlines complex chart creation using advanced AI; Google sign-in integration.
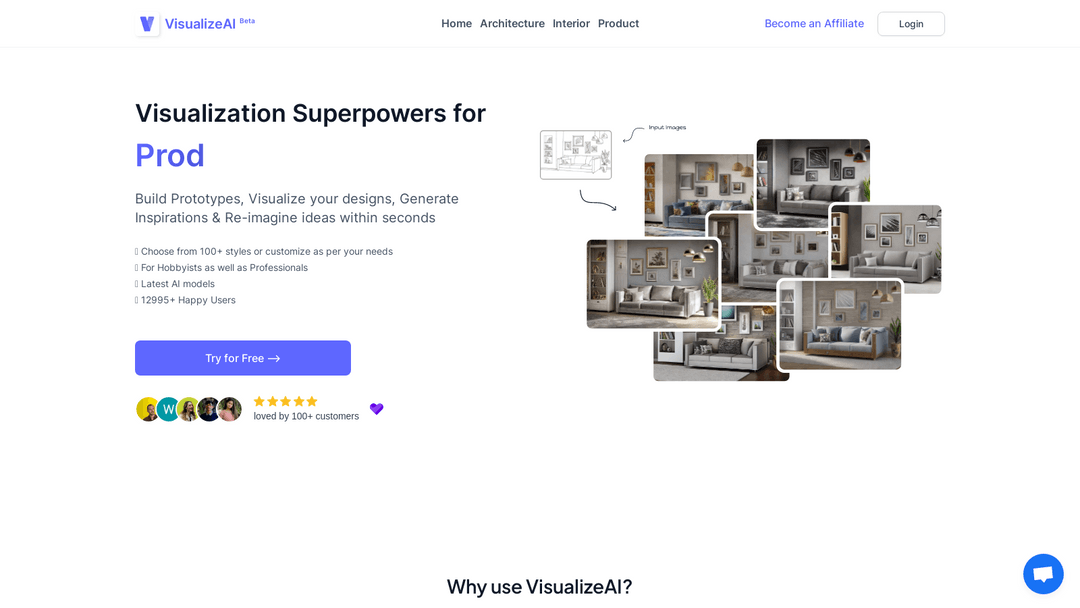
5. VisualizeAI
VisualizeAI provides a platform to design and visualize product prototypes using AI.
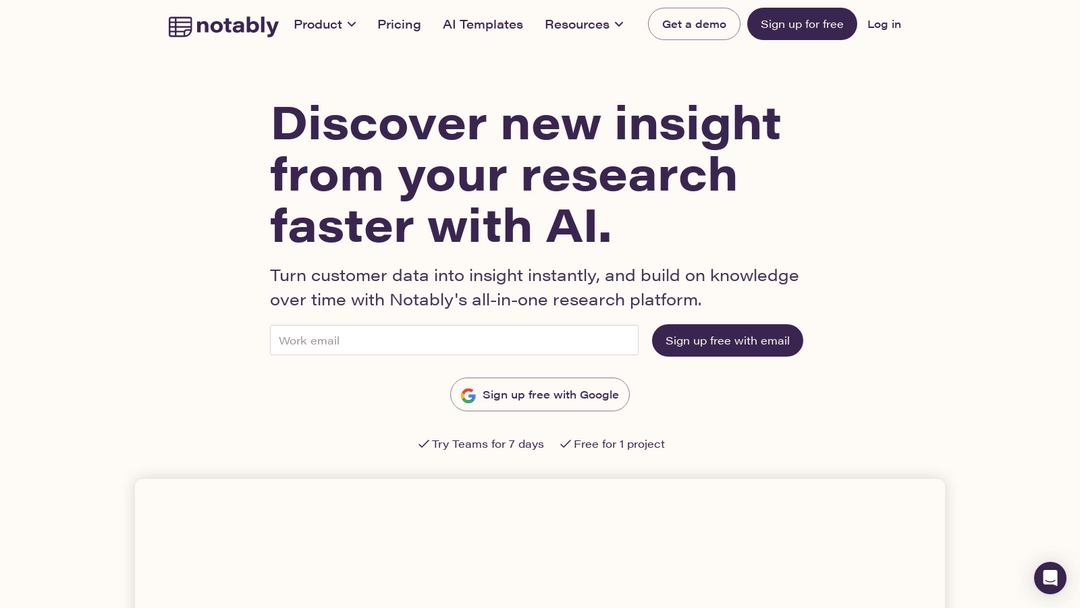
6. Notably
Facilitates swift, effortless conversion of complex data to actionable insights with AI.
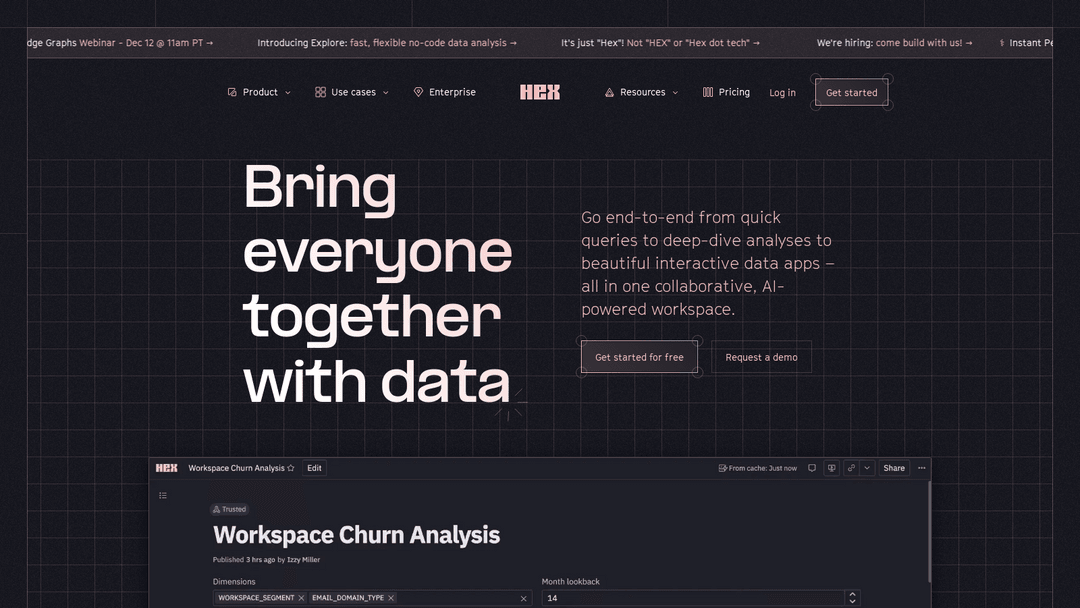
7. Hex
Hex facilitates interactive data exploration and collaboration through AI-enhanced workspaces.
8. Columns
Natural language-driven, fast data visualization and collaborative, secure storytelling tool.